Welfare example with a Quota
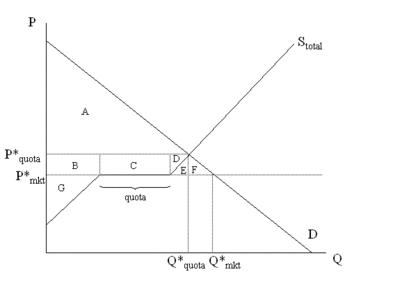
Okay, so I promised that I would come up with a better way to show social welfare in the quota situation (remember the E' and E'' nonsense?), and here it is. Basically, as I was going through the example in section, I realized that it was completely unintuitive, so I worked a bit on coming up with something easier to understand. I hope this is helpful. This is another way to show the diagram on page 186 of the textbook, and it can replace the example from section that we didn't get all the way through. I had showed how you could use the domestic and world supply curves to come up with an overall supply curve, so the diagram looks like the following:
Now, the relevant parties in this market are consumers, producers and license holders. License holders are allowed to buy on the world market and sell domestically, so they earn a profit because the equilibrium price is higher than the world price (if the quota is binding). Therefore, surplus is as follows:
Therefore the DWL is E+F. The CS and PS are found using the precise definitions: CS is the area above the price line and below the demand curve, and PS is the area above the supply curve and below the price line. There are 2 parts to PS since there is domestic production at the beginning, then imports until the quota is reached, and then more domestic production.
Let me know if you have any questions!


0 Comments:
Post a Comment
<< Home