Tuesday, October 18, 2005

Welfare example with a Quota

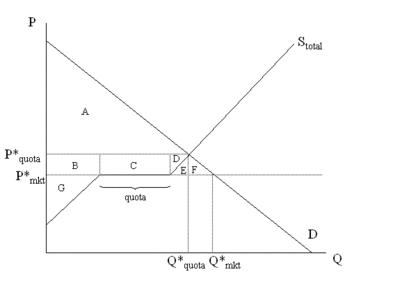
Okay, so I promised that I would come up with a better way to show social welfare in the quota situation (remember the E' and E'' nonsense?), and here it is. Basically, as I was going through the example in section, I realized that it was completely unintuitive, so I worked a bit on coming up with something easier to understand. I hope this is helpful. This is another way to show the diagram on page 186 of the textbook, and it can replace the example from section that we didn't get all the way through. I had showed how you could use the domestic and world supply curves to come up with an overall supply curve, so the diagram looks like the following:


Now, the relevant parties in this market are consumers, producers and license holders. License holders are allowed to buy on the world market and sell domestically, so they earn a profit because the equilibrium price is higher than the world price (if the quota is binding). Therefore, surplus is as follows:


Therefore the DWL is E+F. The CS and PS are found using the precise definitions: CS is the area above the price line and below the demand curve, and PS is the area above the supply curve and below the price line. There are 2 parts to PS since there is domestic production at the beginning, then imports until the quota is reached, and then more domestic production.


Let me know if you have any questions!
Sunday, October 16, 2005

Review Session and Office Hours

I just wanted to let you know that the review session for Wednesday's midterm will be on Monday from 7:35-9:35 in Vanserg 24B. If you have a conflict, please let me know and I will try to direct you to another review session. (However, most reviews are on Monday so the options may be limited.) I am trying to find a larger room, since there are about 40 of you, and I'll keep you posted on that.


Also, my office hours for this week will be on Tuesday from 3:30-6, so that you can come and ask questions before your exam.

Wednesday, October 12, 2005

Organ Donor Question

Q:

I have a question about the part d and about the entire first question in general...What are we to do about price? People don't pay for organs...there aren't different prices - how do we graph demand if there is no price that they pay? For part d specifically, are we assuming price is what the government subsidizes the donor?

A:

I apologize for this question being confusing. You can think about the question as follows: consumers and producers of organs actually behave in accordance with the willingness to pay and willingness to supply as given by the equations. In other words, they would be willing to move to the market equilibrium and pay a positive price if they were left to their own devices. The complication that the article brings up is that basically the government has set a price ceiling (and a price floor) at P=0 by not allowing people to pay to receive organs, since this is considered, well, unfair. But you can see that at P=0 there is a shortage. So you can graph the demand as normal but recognize that the price that the consumer pays has to be zero. Therefore, in order to get supply to meet demand, the government can offer a subsidy, which will shift the supply curve to the right (and effectively give the producer a positive price). If it offers the right subsidy, the new equilibrium will in fact be at P=0 and there will be no shortage or surplus.

Small Country Assumption

Q:

In problem set 2, question 4, the 5% figure they give us just lets us assume the market in country X doesn't affect the world price, right? Is there a generally accepted percentage range for assuming this?

A:

You're right, the 5% just gives justification for the small country assumption. In general, I don't know of a specific threshold for being considered a small country. On problem sets and exams, you will either be told that you can make the assumption, or you can explicitly write that you are making the small country assumption and state your reasoning.

Monday, October 10, 2005

Subsidy Q&A

(this post refers to problem set 2)

Q:

Question 2 on the problem set mentions a subsidy. If you impose a subsidy on the producers, logically the supply curve must shift to the right, right?
I'm wondering this because we didn't really cover subsidies and in our work on taxes, only the quantity changed, not the S or D curves. Is this the same for subsidies? Also, wouldn't the government surplus be negative if it gave a subsidy to producers?

A:

In general, you are correct, but be careful with your terminology. With a tax (or a subsidy), the curves don't ACTUALLY shift. The drawing of the new curve that we did is called an "effective shift". This is because none of the determinants of demand or supply actually changed, but once we have a tax we have the supply curve in terms of the price that the producer keeps, and the demand curve in terms of the price that the consumer pays. When we draw the effective supply curve for example, this represents the production of the suppliers as a function of the price that the consumer pays, so that we can then compare apples to apples and get an equilibrium. With your subsidy question, your effective supply curve would be to the right of the actual supply curve.


If you recall our work on taxes, we talked about two methods of finding the new equilibrium once a tax is imposed. One was to draw the effective supply or demand curve and find the new equilibrium that way. The other was our wedge story, which is what I think you are referring to. In this analysis, the curves don't shift, but you look for the quantity where there is a vertical distance the size of the tax between the demand and supply curves (to the left of the old equilibrium). In this case, the price that the consumer pays (found on the demand curve) is greater than the price that the producer receives (on the supply curve) by the amount of the tax. For a subsidy, you would have to look to the right of the old equilibrium to find a similar wedge, since with a subsidy the price that the consumer pays is less than the price that the producer receives. (Basically, a subsidy is just a negative tax) Government surplus would indeed be negative, since they are paying out money and (in our model) not getting anything in return. This makes sense mathematically if you think about the equation I gave for government revenue and then consider that the subsidy is a negative tax, so T would be less than zero.

Turning in ps2

Your second Ec10 problem set is due on Friday, October 14th. There is a logistical complication with the due date in that you have lecture rather than section on that day, so it is not clear how you would turn in your problem set. So, I am offering two options for you to turn in your problem set:

1. I will arrive at Sanders theater a few minutes before noon and stand in the lobby area. You can hand your problem set to me there.

2. You can put your problem set in my "mailbox" (read, folder) on the second floor of Littauer any time before noon on Friday. Go up two flights of stairs from the front entrance and make a left down the hallway. You will see hanging file folders on the right hand side of the hallway.

Wednesday, October 05, 2005

Okay, so I lied...

Remember when I said that unless specifically told otherwise, we are looking at parallel shifts of demand and supply curves rather than pivoting? Well, on question 4 of PS1, you are in fact being asked to pivot the demand curve. That should be obvious from the math, but I didn't want people to get confused since I said to not expect to have to do that.

Fenway Park PS1 Question

Q:

In the text book it says that as the supply of a good becomes
more inelastic the tax incidence falls more heavily on the seller. However, if
the seller is selling the same amount of good and simply requests the additional
amount of tax from the consumer then where does the incidence come in? It seems
as if the incidence actually falls entirely on the consumer because they're
paying the tax in addition to the regular price of admission. Also, because
the supply is inelastic, the park will sell the same number of tickets
regardless of the tax. Or did I miss the fact that the stadium must lower the
price of the ticket so that with the tax it is equivalent to the original
ticket price?


A:

What you mentioned regarding the statement in the book is correct, and you can convince yourself that this is in fact the case by drawing a few diagrams. With regard to the problem set, it merely says that the consumers dutifully pay the tax. All we are trying to say is that they do in fact send in the $5 and don't get around paying the tax. This does not imply that consumers' demand doesn't change. Say for example that demand at $30 was 40,000 tickets, pre-tax. Demand would still be 40,000 tickets if the consumer had to shell out a total of $30, but in the case of the tax, the face value of the ticket would have to be $25 for this to be the case. So we get an effective demand curve like we did in class. Therefore, the seller can't just request the additional tax from the consumer, since the quantity demanded would be less if the total cost to the consumer was higher. The producer would not be selling all of the tickets and would want to lower the price in order to sell all of the tickets, thus bearing the burden of the tax. This should be pretty clear if you draw the diagram. I think it is the way the question is worded that makes it confusing, since it implies that the demand is unaffected by the tax.

One other note- be careful with your wording...you state "because the supply is inelastic, the park will sell the same number of tickets regardless of the tax". While it is true that they will SUPPLY the same number of tickets, the number of tickets actually sold is determined by both the supply and demand curves. In equilibrium, the number of tickets sold will be the intersection of the supply and demand curves. If the market is out of equilibrium, the quantity transacted will be the minimum of supply and demand (since the minimum is the limiting factor). Thus, the number of tickets the park actually sells is a function of the price it sets.

Tuesday, October 04, 2005

Production Possibilities Frontier

Q:

When we are required to draw the graph of the PPF, do we also indicate the midpoint at which the person/country/entity would produce and consume if no trade occurs? Or, is it enough that we indicate the amount of good produced on the axes and connect the dots?


A:

In general, I would say the latter of your two options, as long as you can assume that your PPF is a straight line (as done in Mankiw). Technically, you might not have enough information to figure out where the "no trade" production point is, since it depends on the preferences of the entity for one good over the other. While it is true that the figures in Mankiw show the no trade point to be at the midpoint of the line segment, there is no reason that this needs to be the case. If you look at the middle of page 48, the paragraph that starts with "Although these production possibilities frontiers..." should make this clear.